
Symbols are used to give meaning to data in maps. Choosing appropriate symbols can make your map more useful and easier to interpret. In this course, you will work with single, unique-value, and graduated symbols.
Learning Objectives
Be able to perform the following tasks:
* Apply a single symbol to a layer in ArcGIS Pro.
* Apply symbols to a layer in ArcGIS Pro using categorical and quantitative attributes.
Symbolising Qualitative Data
Single Symbols
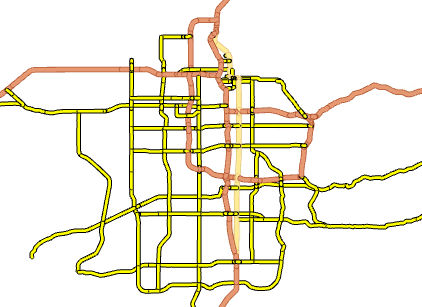
Use fields within a map layer to change the symbology of a lyer. In this example, the map is symbolised by road type.
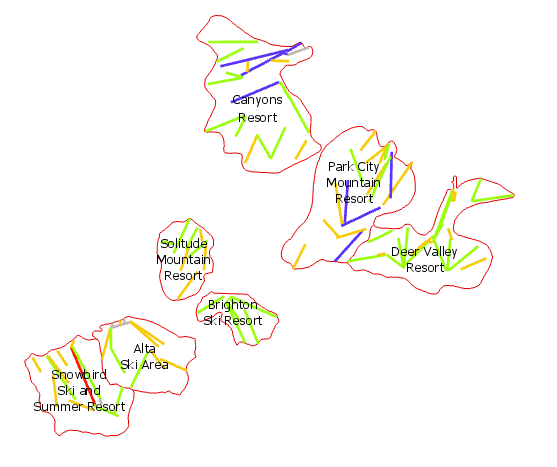
Unique Values
When displaying qualitative, categorical values, provide more information at a glance by using unique-value symbology instead of single symbols. Apply unique values to any feature type (point, line, or polygon).
The first step in symbolizing by unique values is to choose an attribute field from which to take the values. The values in this field are commonly text. However, the values might be numbers that represent a category rather than a quantity.
Assign Graduated Color
By changing line weights and colors the map becomes more meaningful.
Certificate

Recent Comments